
Summary
- EIR’s data-centre page, counted on 12 October, showed 92 public-report incidents across 27 countries, with 46 dated 2024 or later. Its files page still advertised 93 data-centre entries and dated its citation to 11 October; a DatacenterDynamics report published on 12 October also used 93 and 47. The pages do not explain the one-entry difference.
- EIR’s own methodology says counts are not rates and that a rising line usually reflects better collection. Without a dated revision trail and the size of the full fleet at risk, the tally can guide investigation but cannot price facility reliability.
The one-entry gap is a useful place to start. EIR’s live data-centre page says it was counted from the register on 12 October: 92 entries, 27 countries and 46 incidents since 2024. Its year table shows eight entries in 2024, 20 in 2025 and 18 in 2026. The separate data-download page still advertises a 93-entry data-centre file, with a dataset citation dated 11 October. DatacenterDynamics’ 12 October report repeats 93 incidents, 47 since 2024 and 26 countries.
These figures may reflect different refresh times or treatment of entries, but the pages do not provide a change log that explains this specific difference. EIR says provisional incidents can be revised or removed and that removed reference numbers are not reused. That makes a dated snapshot and an entry-level revision history useful parts of the evidence, not administrative extras. The mismatch does not show that any incident record is wrong; it shows that a reader cannot reconstruct the transition from the published totals alone.
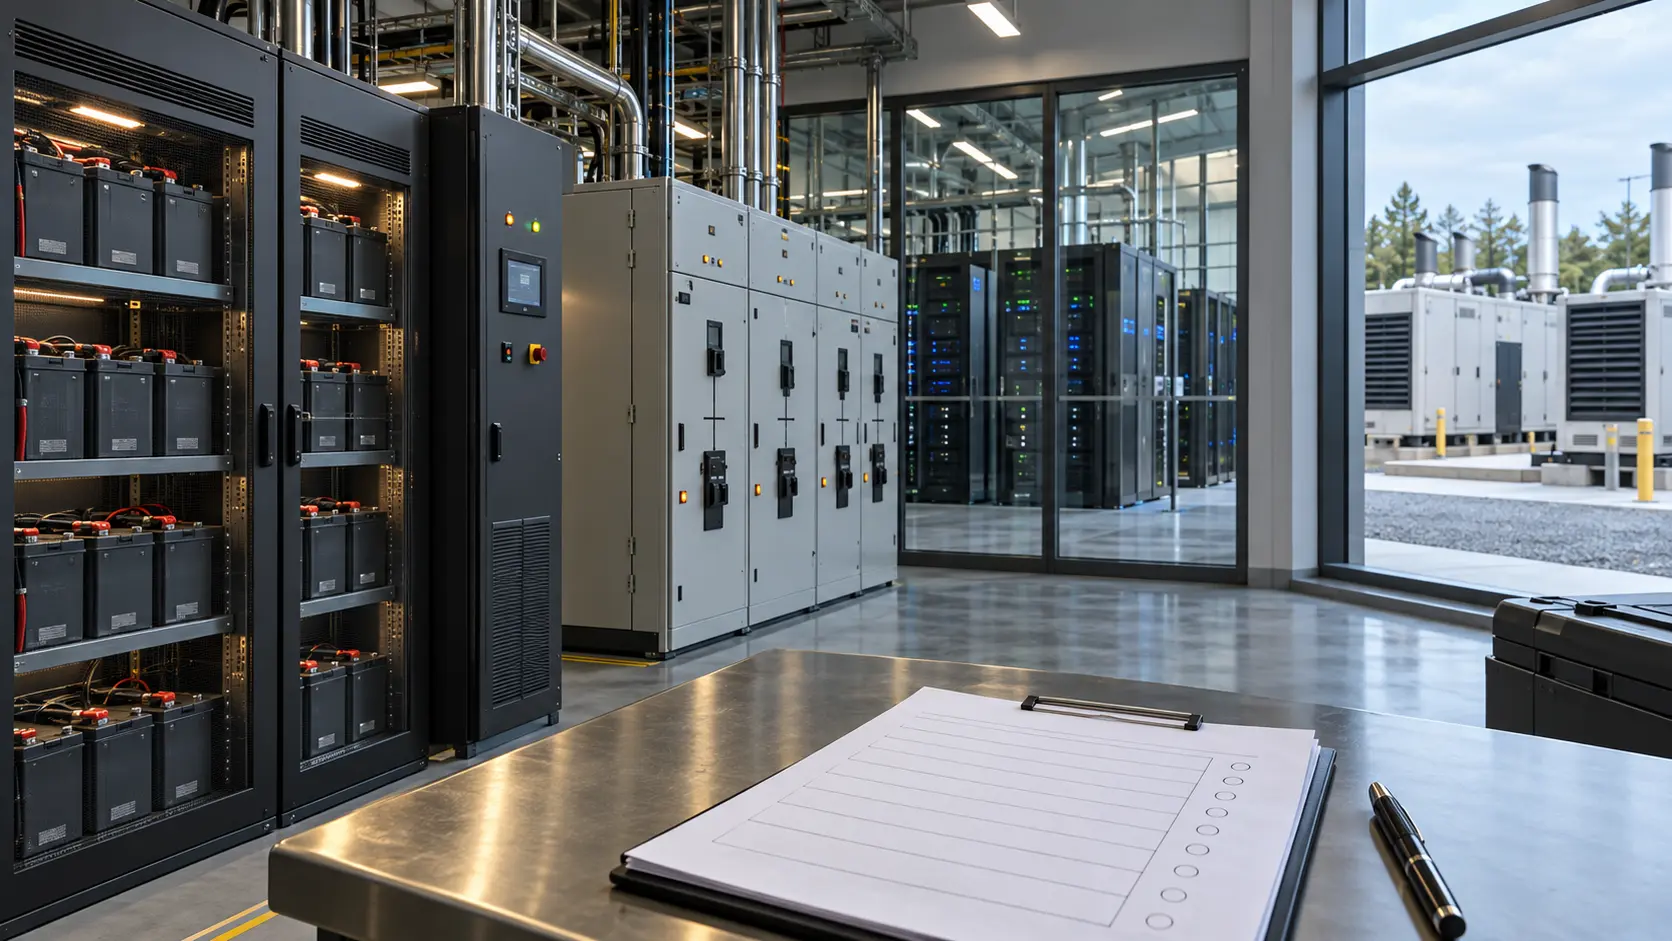
The current live page gives a more consistent October 12 snapshot: 92 entries from 27 countries, 46 from 2024 onward, 52 classified as fires or thermal events and 17 as major. Reports name UPS or battery rooms in 22 entries, backup generators in 15, switchgear or electrical rooms in 10, transformers or substations in four, and fuel systems in two. The page says 52 entries do not name a failed component. Categories can overlap when a report names several parts. “Not stated” describes the public report, not what an investigation may have established.
These are incidents found in public reporting, not a census of every data centre or outage. EIR’s methodology says countries with open reporting and technologies that attract press attention are over-represented; English-language sources dominate. It also says the register does not know the installed fleet behind the incident sites, so the counts cannot be converted into incidents per gigawatt. A larger installed base can produce more entries without a higher failure rate at each site.
Scope and collection have changed too. Data-centre power systems entered EIR’s scope on 2 October 2026. The list covers incidents beginning in UPS battery rooms, generators, switchgear, transformers and fuel systems; outages caused only by software, networks, cooling or a cloud provider’s systems are excluded. EIR’s methodology says a rising line usually means better collection and warns readers not to treat its trend chart as a trend in industry safety. The new category places older incident years beside a newly expanded search, so the historical line needs that context.
Uptime Institute’s May 2026 outage analysis supplies a different measure: its public abstract says per-site outage frequency declined for a fifth consecutive year, while major data-centre fires increased gradually. It says rapid facility build-out may explain part of that rise. Uptime’s operator survey and EIR’s public-report register cover different populations and answer different questions. Their results can coexist without either validating or cancelling the other.
For operators, insurers, lenders and customers, EIR is a discovery map. It can help identify incidents and formulate questions about backup-power systems. It does not rank technologies by failure probability, attribute fault to a supplier or price an individual facility’s reliability. A market comparison needs a stable event snapshot, a defined reporting window, the full in-scope fleet or equipment exposure, and comparable measures of severity and recovery time.
Sources
Member Briefing
Deeper Profile Context
Sign in with the right membership level to unlock the full briefing and source notes.
Only for Strategic Circle
Strategic Circle
Open to all readers. Unlock profile briefings after joining and signing in.
Join Strategic CircleOnly for Leadership Alliance
Leadership Alliance
For qualified IP-asset owners and management; sign in to unlock alliance briefings.
Join Leadership Alliance