
Summary
- Webvan's FY2000 filing described an integrated online store, automated warehouse and scheduled home-delivery system. Its larger distribution centers were designed for 8,000 orders a day each.
- The company said every facility's daily order volume remained well below design and below the level needed for that facility to become profitable. Distribution centers operated at less than 40% of designed capacity.
- The same filing recorded $178.456 million in 2000 net sales, a $453.289 million net loss, $263.1 million of operating cash use and $259.8 million in capital expenditures. Those are separate measures of the business, not one interchangeable bill for empty capacity.
A shopping cart opened a factory door
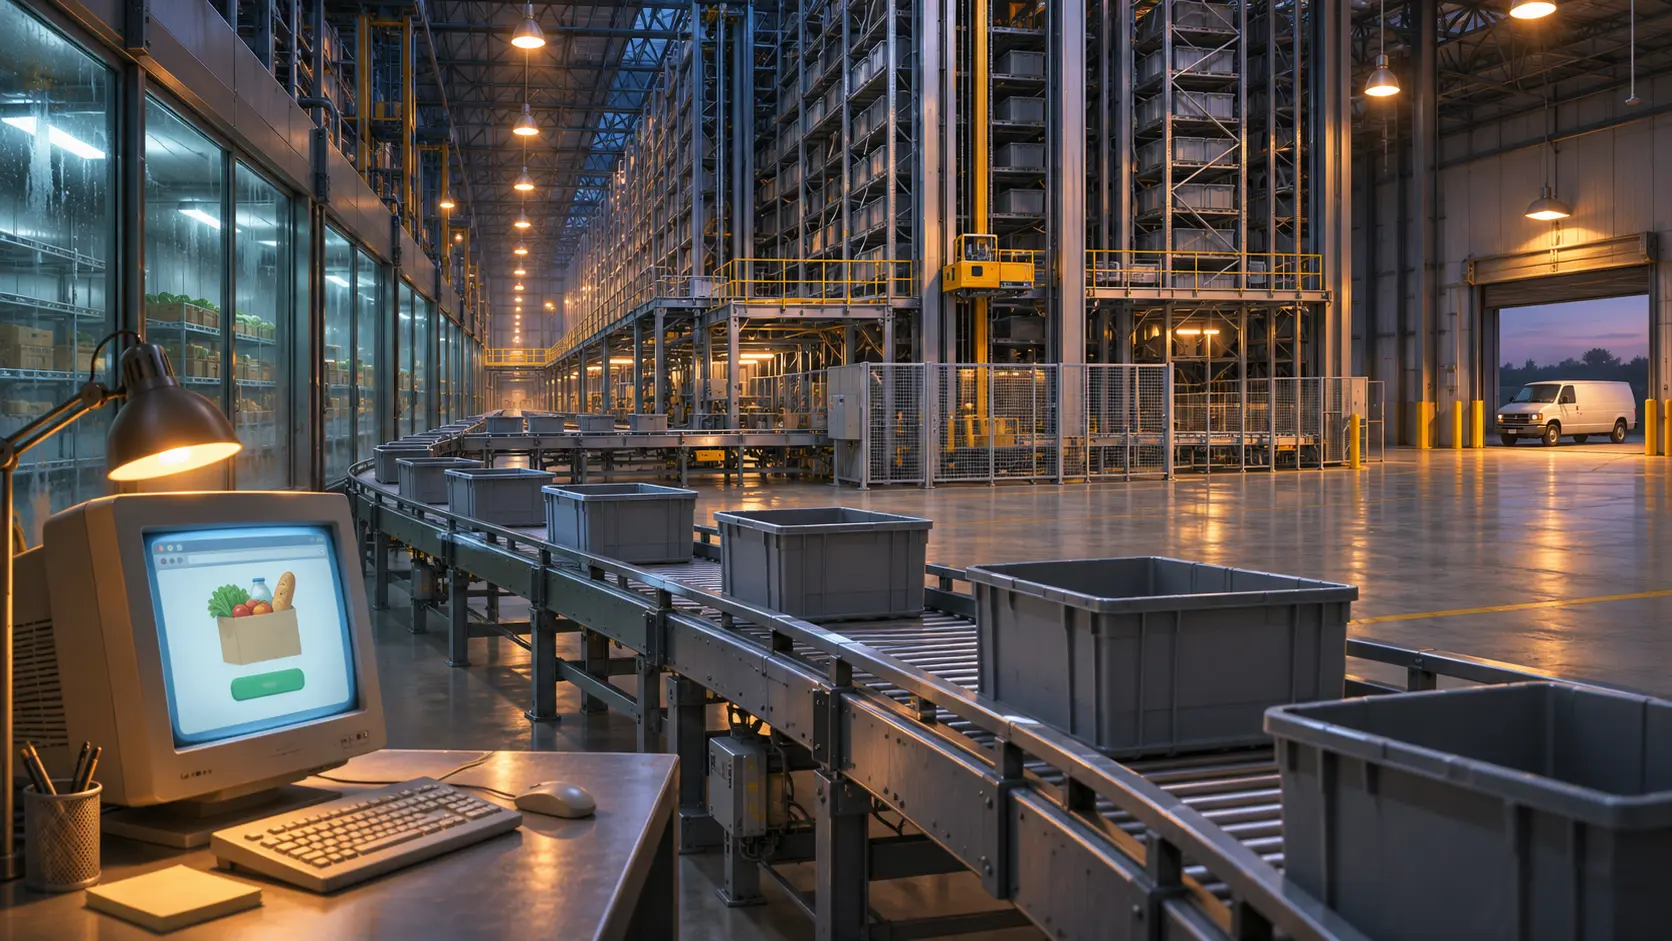
Webvan's web store could show a customer only the goods available at the facility serving that address. The customer filled a cart and chose a delivery window. Behind the screen, software sent instructions through inventory and warehouse systems to conveyors, carousels and manual picking racks; a route planner then placed the order on a trip to the front door. The company's 2000 Form 10-K described the web store, distribution facility and delivery system as one integrated design. The clever part of the website made a promise the physical system had to keep.
The larger distribution centers occupied about 350,000 square feet apiece. Three were listed in Oakland, Suwanee and Carol Stream. The smaller customer fulfilment centers acquired with HomeGrocer occupied roughly 100,000 to 125,000 square feet. Refrigerated and frozen areas, mechanized handling and delivery vehicles made this a business with a material footprint before a shopper placed the next order. A city could be offered an elegant checkout while the capital already sat in steel, cold storage and routing.
Eight thousand was a design number
The annual report gave each distribution center an originally designed capacity of 8,000 orders per day; each smaller fulfilment center had a 2,500-order design. It then supplied the uncomfortable operating fact. Average daily orders at every facility had been significantly below the relevant design capacity and below the volume needed for facility profitability. Distribution centers were running at less than 40% of designed capacity; the smaller centers at less than 70%.
That percentage describes the company's reported operating capacity, not an exact published order count for Oakland, Suwanee or Carol Stream. The filing does not break out site-by-site daily orders or margins. A dated facility ledger would establish the trajectory at each building. What the annual report does establish is enough: the company had installed a system whose profitable scale depended on orders that had not arrived.
Management also stated that the system could not practicably be tested at full scale except by processing real commercial orders. Its historical volumes had therefore left the design unproven near capacity. The report expected that a distribution center would take several years to reach its design level, and gave no assurance that one ever would. The critical experiment had a peculiar laboratory: an operating warehouse with real payroll, real spoilage risk and real delivery windows.
The financing clock kept running
Webvan had signed a 1999 agreement for design and construction of up to 26 distribution centers. That was a ceiling in a contract, not a count of completed warehouses. By the 2000 report the company had also absorbed HomeGrocer and was converting the acquired facilities to one technology platform. The first conversion, in San Diego, took place in January 2001. Expansion and integration were being managed while the existing centers still had excess capacity.
The filing reported $178.456 million in 2000 net sales and a $453.289 million net loss. Operating activities used $263.1 million in cash; capital expenditures were $259.8 million. The figures describe different accounting and cash-flow surfaces, and the net loss included costs beyond warehouse underuse. At year-end the company listed $40.3 million in cash and equivalents and $171.6 million in marketable securities. An online order could be cheap to click, but it did not pay the same bill as a refrigerated network.
The later SEC administrative record dates Webvan's Chapter 11 filing to 13 July 2001. That endpoint belongs after the annual report, which was filed in April. The stronger historical evidence is the April admission itself: the throughput required by the design was still a forecast, while the building and its operating costs were present tense.
Sources
- Webvan Group, FY2000 Form 10-K, filed 2 April 2001: store-to-door system, facility dimensions, designed and reported capacity, financial statements and liquidity.
- US Securities and Exchange Commission, Webvan administrative order: the 13 July 2001 Chapter 11 filing date.
Member Briefing
Deeper Profile Context
Sign in with the right membership level to unlock the full briefing and source notes.
Only for Strategic Circle
Strategic Circle
Open to all readers. Unlock profile briefings after joining and signing in.
Join Strategic CircleOnly for Leadership Alliance
Leadership Alliance
For qualified IP-asset owners and management; sign in to unlock alliance briefings.
Join Leadership Alliance