Summary
- NAPAfrica's home page printed "7.34 Tb/s All-Time Peak Traffic" beside "Weekly Peak 7.39Tb/s" at 15:44:02Z on 21 November 2026, with no date and no measurement window on either label.
- The same estate gives its connected-network population four times — more than 380, over 680, 698 plus, over 300 — and prints one 2362 port figure for a footprint its counter calls 3 Locations while the participant table spells four facility codes.
- Per-site traffic exists as three city sections and one group section, all charts and no readable numbers, so the sum of site maxima that would test the group figure cannot be built from these pages.
I came to NAPAfrica intending to add something up. An exchange that publishes one traffic figure per site has published several maxima and no maximum; if it also prints a group figure for the same period, a reader with the pages open can put the sum of the site maxima beside the aggregate and learn how the footprint loads. NAPAfrica's per-site traffic page does not permit that addition. It carries a group section and three city sections — "Total Traffic across NAPAfrica", "IX-Johannesburg", "IX-Cape Town", "IX-Durban", with labels "IX-JHB Location", "IX-CT Location", "IX-DB Location" — and no numeric value in readable text in any of them. That field of the plan is answered as an absence, not as a total, and this piece reports what the same estate does print instead. This desk's earlier exchange work read European and Asian price pages, admission tests and participant lists; none of it read a multi-site African footprint published as live counters.
What it prints is a counter block that redraws. At 15:44:02Z the home page rendered: "Statistics NAPAfrica in Numbers 698 + Connected ASNs Explore 7.34 Tb/s All-Time Peak Traffic Live Traffic Weekly Peak 7.39Tb/s Current 5.75Tb/s Location South Africa JB / CT / DB". At 15:41:51Z the same address had rendered "680 Peering, 6 Traffic, 2362 Ports and 3 Locations". At 15:47:14Z the live string read "Current 6.74 Tb/s". Three states of one page inside six minutes, and the live figure nearly a terabit above where it had been. No reviewed page says what any of those labels measures.
Start with the pair the block prints side by side: "7.34 Tb/s All-Time Peak Traffic ... Weekly Peak 7.39Tb/s". The weekly peak is 0.05 Tb/s above the all-time peak, which is about 0.68 per cent of the printed all-time figure, or 50 Gb/s. That subtraction, that division and that conversion are mine, performed on two numbers the operator printed next to each other. The next sentence is mine as well. A weekly maximum cannot exceed an all-time maximum for a series that contains that week: seven days sit inside the whole record, and the all-time label is by definition the largest value that record has reached.
The two printed labels cannot both describe one series unless the all-time figure is not the maximum of that same series. No reviewed page dates either figure, names the series, or states a window, so the reader gets the pair and no way to settle it.
Then the population. The same home page says "With more than 380 member ASNs, from over 50 countries around the globe - NAPAfrica is the largest Internet eXchange on the African continent." and, elsewhere on itself, "NAPAfrica offers direct access to over 680 unique networks (ASNs) servicing over 50 countries." The counter above it reads "698 + Connected ASNs". The about page says "NAPAfrica IXP offers direct access to over 300 unique networks (ASNs) servicing over 20 countries in the southern African region." The landlord's peering page says "NAPAfrica offers direct access to over 680 unique networks (ASNs) servicing more than 25 countries in the southern African region." Four lower bounds for one population, and two different lower bounds for one country count. My arithmetic on the extremes: 698 minus 300 is 398, and 698 divided by 300 is about 2.33. These are floors carrying "more than", "over" and a plus sign; they are not point estimates, I do not average them, and I do not adopt one as the operator's true size.
Ports next. The participant page strip prints "698 + Connected ASNs ... 2362 Client Ports", and the strip reused across the site renders on the topology page as "680 + Peering 6 Tbps+ Traffic 2362 Ports 3 Locations". 2362 is one number for the whole footprint. No reviewed page splits it by site. Dividing it by a population floor gives about 3.38 ports per connected network, which measures nothing: a port count and a network count are different populations, and the network count is itself a floor.
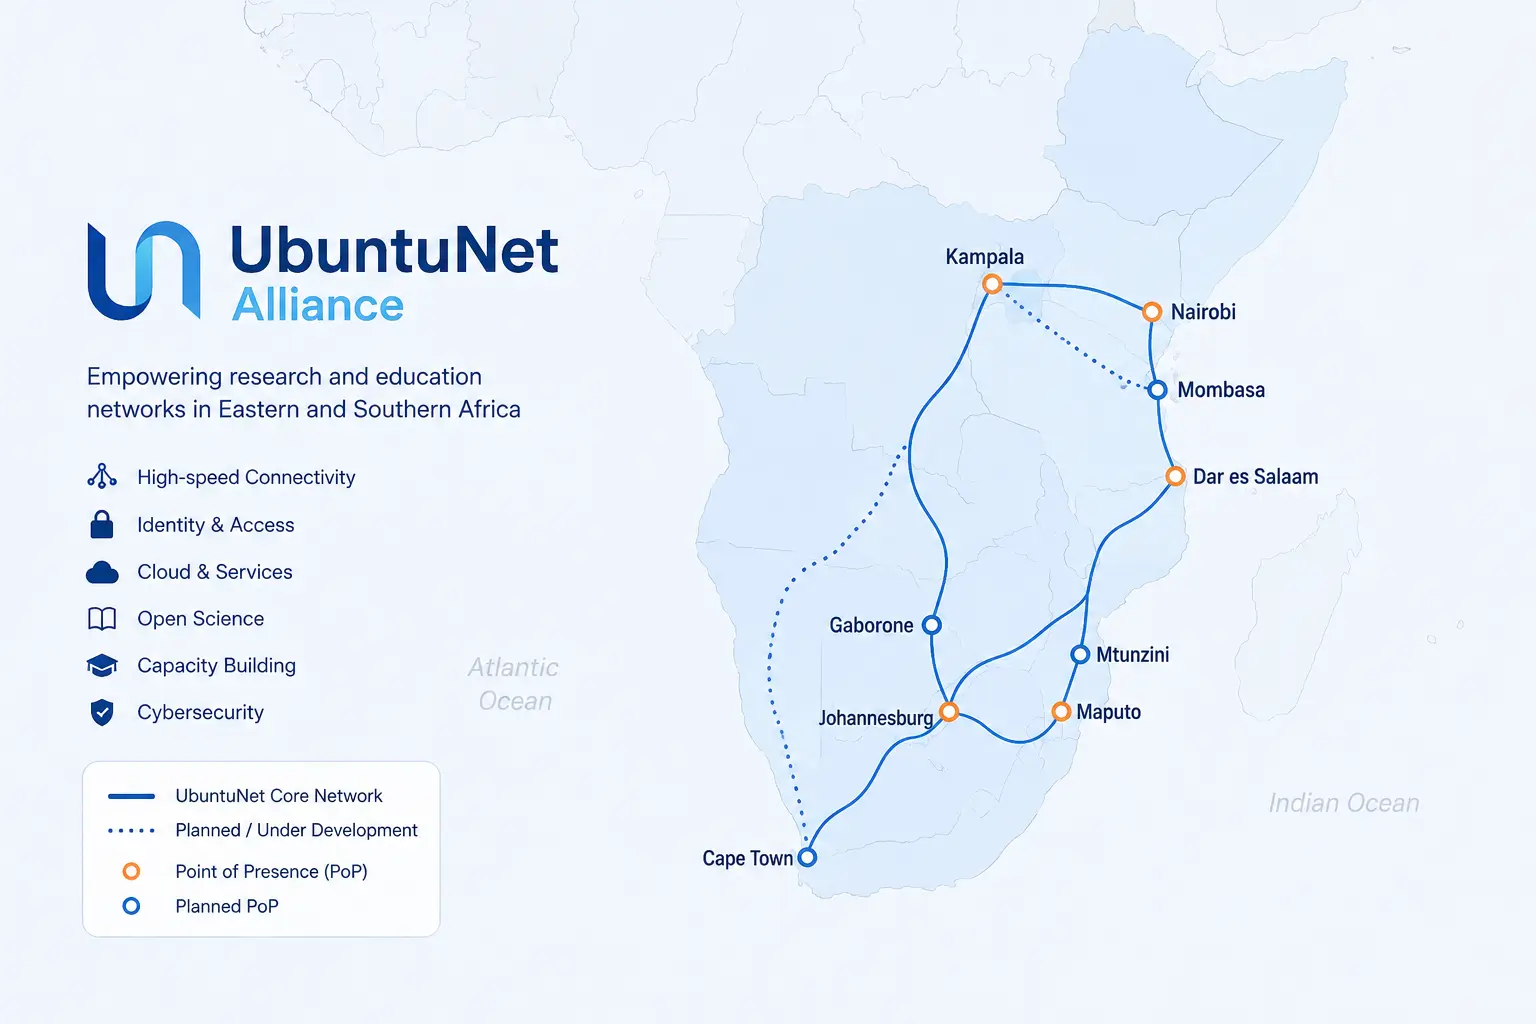
The participant table is described as "a detailed list of clients peering at NAPAfrica, including AS Numbers (ASNs)", and its columns are "DC | Name | ASN | URL | Peering Policy | Route Server Peer | IPv4 | IPv6 | MANRS | Joined". There is no city column. Location is a data-centre code. In the rows I could read the codes were DB1, CT1, JB1 and CT2; the extraction was truncated, so that is what I observed, not a proven list. Four codes, three cities, and the resolution of two of them sits on the landlord's pages, not the exchange's: Teraco's Cape Town page reads "Cape Town: Rondebosch & Brackenfell ... CT1 & CT2", its Durban page says "DB1 is a data centre facility in Durban", and its Johannesburg page places "JB1 East & West Data Centre ... Address: 5 Brewery Street, Isando, Johannesburg". NAPAfrica's own topology page labels one code with a city: "JB1 | Johannesburg". Nothing in the reviewed set reconciles the counter's 3 Locations with the table's four codes. Both are reported here, the tension stays open, and calling either of them wrong would be a claim the documents do not support.
The traffic page is where the display layer stops pretending otherwise. Its caption reads "Live stats. Updated every 5 minutes." and its text divides the world in two: "Information on the consolidated traffic at NAPAfrica is publicly available, while detailed traffic graphs for each individual switch port will be available to NAPAfrica peers on request." Five minutes is a refresh interval. A measurement window would state the period the number covers — the last five minutes, the last day, the peak since January. Of the pages read on 21 November 2026, none states one for any traffic figure. So the reader is told how often the picture is redrawn and never what the picture is a picture of.
In the documents read, the only place a number appears per neighbour is the public looking glass, which opens with an access condition rather than a total: "This is the public looking glass. Uncached results and additional routers available when logged in." A Cape Town IPv4 route-server page prints rows such as "196.60.70.5 | XDSL | 36916 | T36916x1 | 38/200 | 38" — a session's prefix count, not a site's. No reviewed page prints an aggregate session or prefix count for any site. The additional-services page gives a per-LAN count and an undated share: "NAPAfrica IXP multilateral route servers are provided to all members free of charge. There are 2 of these servers on each of the NAPAfrica peering LANs for additional resilience. Almost 90% of NAPAfrica members peer using this method." Nothing dates the 90 per cent.
One more pair, and it is about documents rather than numbers. The site still hosts a guidance PDF, Version 0.1, dated 8 February 2010, which says: "NapAfrica recommend against overloading your ports, and we will get in touch when traffic at 95 th percentile exceeds 75% of the port capacity." and "When traffic reaches 50% of your port capacity, then NapAfrica will discuss suitable upgrade options (higher port capacity or aggregated links)". The same sixteen-year-old document contemplates a charge: "If you already have routers installed in Teraco then the port fee is waived. ... If you do not have equipment present in the Teraco data centres, then a small port fee will apply." No amount appears anywhere in it. Against that, the current home page states, twice, "NAPAfrica does not charge membership fees, port fees or cross-connect fees to access the infrastructure." and "100% FREE Peering. No Membership Fees, No Port Fees, No Cross-connect Fees." The joining page instructs applicants: "Please download, review and complete the following applicable forms: Participation Agreement Technical Guidelines" and prints no amount itself. The operative agreement was not obtained from the operator's own server, so the no-fee sentences stay in this piece as marketing statements and not as clauses, and the 2010 sentences stay attached to their date and version. What the pair establishes is narrow and still worth having: the one reviewed document that contemplates a port charge does not quantify it, and the two sentences that deny any charge are not an instrument.
Here is what the documents read on 21 November 2026 do not print. One: no numeric per-site traffic value on any page; the city and group sections carry headings, one-line descriptions and charts. Two: no measurement window for any traffic figure; the only cadence is the five-minute redraw. Three: no per-site port count, no per-site capacity, and no split of the 2362 figure among the facility codes. Four: no NAPAfrica page reconciling the 3 Locations counter with the four codes; the code-to-city mapping sits on three Teraco facility pages.
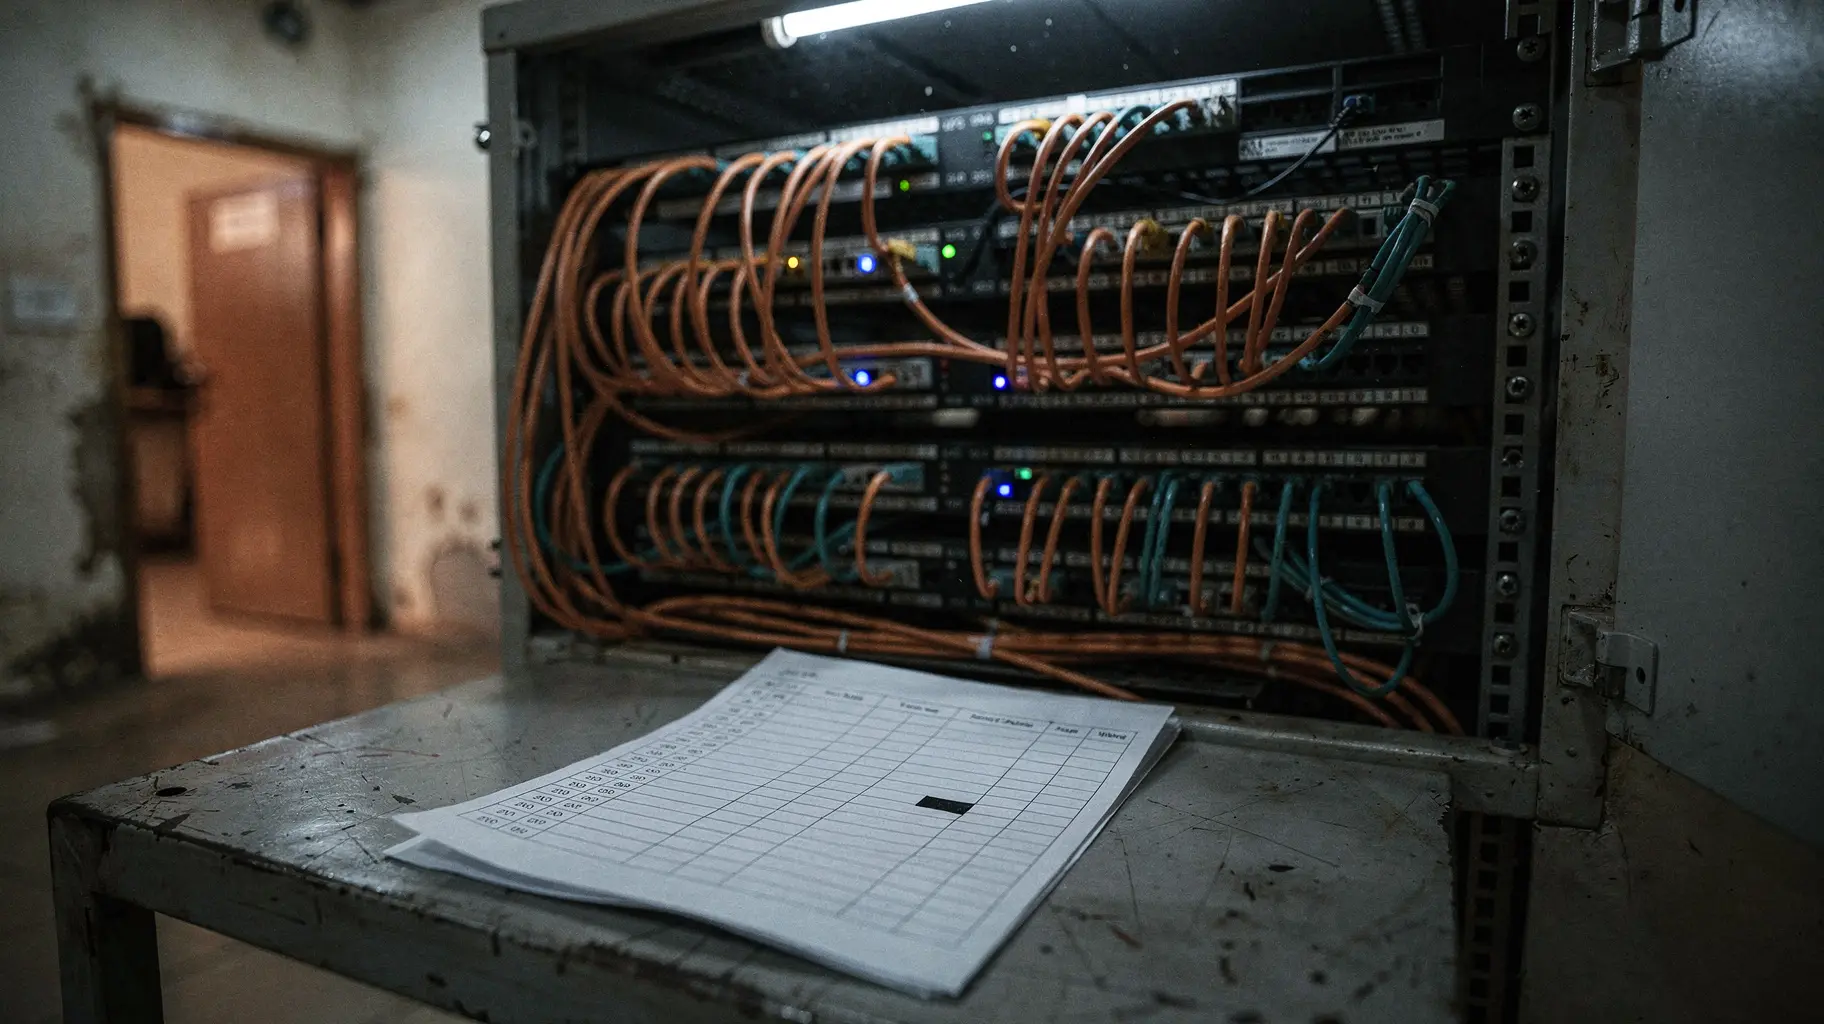
Five: no definition of connected ASN, member, peer, participant or client port, and no statement of whether one network at two facilities counts once or twice. Six: no operative fee amount, because the Participation Agreement was not read here. Seven: no aggregate route-server session or prefix count; the index lists servers and the route-server pages print per-neighbour rows. Eight: the two traffic pages and the topology page returned HTTP 404 to a direct fetch between 15:44:02Z and 15:47:14Z, their text came from search-index extraction, and the charts and the topology figure were never rendered.
Nine: the looking glass printed config-last-updated as unknown for the Durban and Cape Town route servers.
A reader standing at that counter has one verified thing: it redraws, and the number under the label moves while the label stays put. Everything a stranger would need to check the number — the period it covers, the site it belongs to, the noun the population count counts, the facility geometry the location counter summarises — is either absent from the reviewed pages or supplied by the landlord. NAPAfrica publishes the display layer of its own measurement. The record layer belongs, for now, to whoever is willing to say which page they read and when.
Member Briefing
Read the full trend briefing
Members read the full briefing with the source notes behind every finding.
Strategic Circle
A daily briefing in your language, built from changes we have verified.
Join for USD 20/monthCancel anytime.
Members also get the full research library, a daily briefing on the networks they follow and the private forum.