Summary
- A LACNIC 46 presentation frames a 14-second link interruption against an estimated 90-minute route from outage to cause: 23 minutes to the first complaint, then 67 minutes of manual diagnosis.
- The proposed on-premises system combines syslog, RouterOS API data, RADIUS sessions and topology-aware views, then lets an operator query a local language model through read-only SQL.
Fourteen seconds is barely enough time to refill a coffee. In the example presented at LACNIC 46, it can start a 90-minute search for the reason an ISP link blinked. The first customer complaint arrives after 23 minutes; another 67 go to opening routers one by one, filtering their local records and finding a cause. The slide calls this a typical estimated route for a critical event and marks its times as illustrative. Its 14-second cut occupies just 0.26% of the 90-minute diagnosis path.
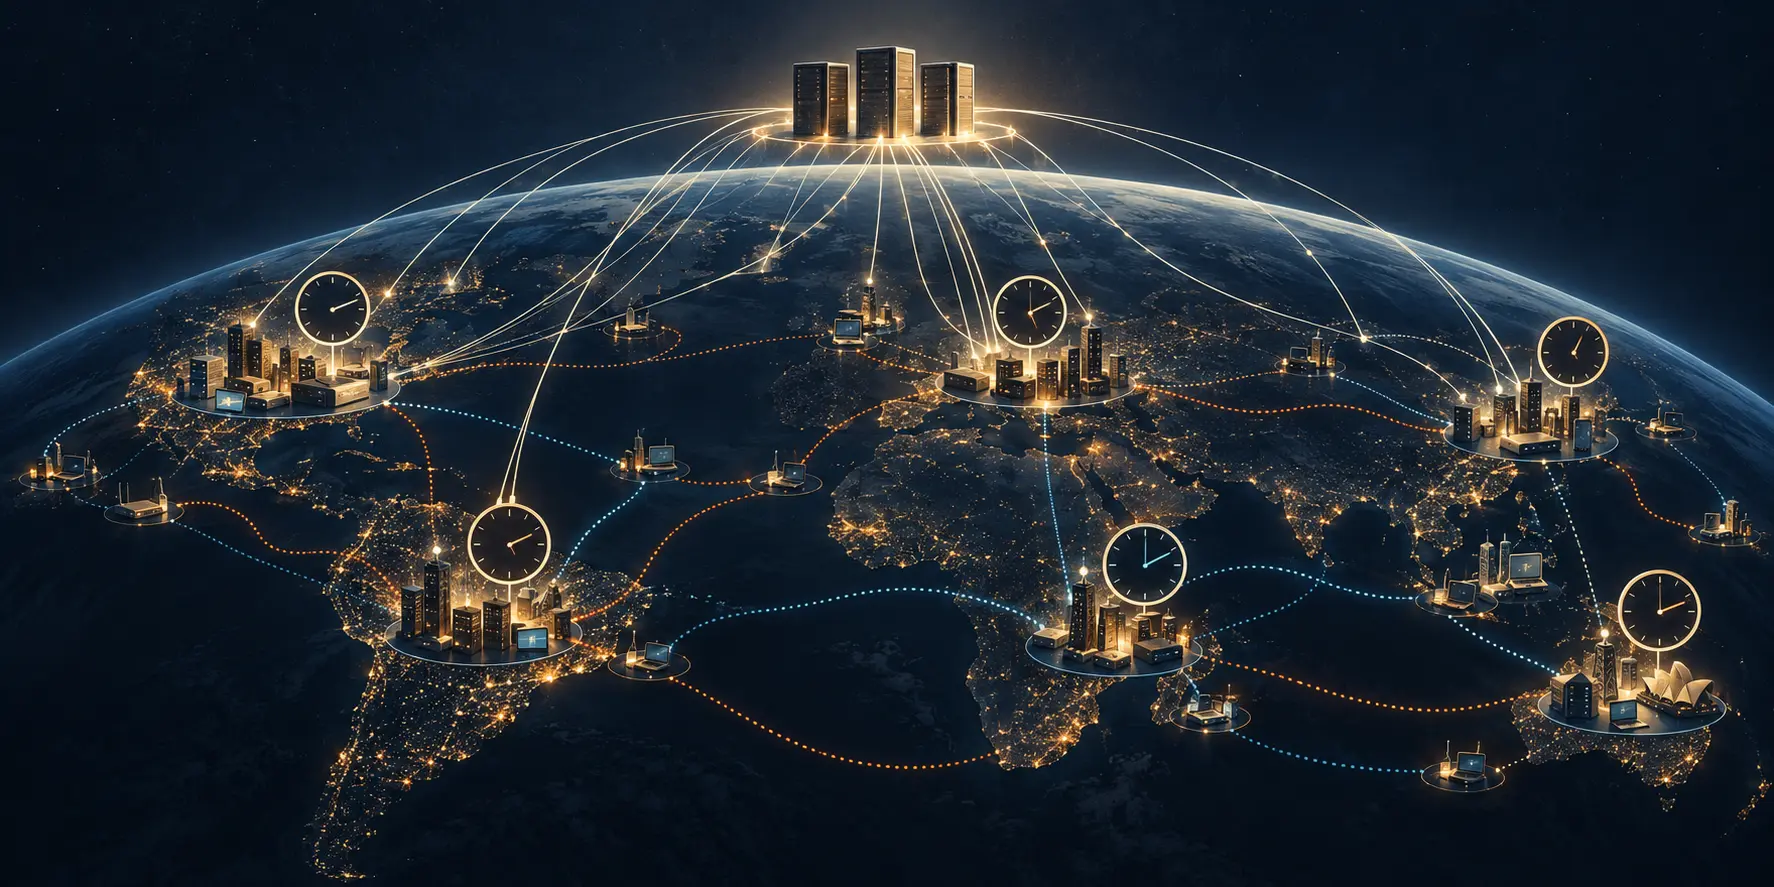
Joaquín Tadeo Riedmaier and Santiago Agustín Zualet, from the Facultad de Ingeniería at Universidad Nacional de Misiones, presented a way to shorten that search during the Internet Measurement Working Group session at LACNIC 46 · LACNOG 2026. They propose collecting the evidence before the operator starts hunting for it: push router events into a local system, pull interface and device measurements through RouterOS v7, and connect both to subscriber and topology records.
The distinction matters. A brief link flap may end before a staff member hears about it, but its syslog event can remain useful if it is captured centrally. A RouterOS API pull can add interface and VLAN traffic, errors and discards, CPU and memory use, connection tracking and ARP state. RADIUS supplies the session side of the picture. The presentation’s proposed stack receives this data on an ISP-hosted Docker node: Django handles syslog and API requests; Python filters noise, normalizes and deduplicates events, and checks thresholds; PostgreSQL stores views arranged for analysis.
Then comes the language model. The system flattens the database views to reduce joins, uses retrieval-augmented generation and gives the model a read-only database account. An operator could ask which routers flapped over four hours; the model would generate a SELECT query and return a count tied to stored rows. That is a sensible boundary: the model may inspect the operational record, but it cannot change the database. The deck says the model was tested on a machine with 32 GB of RAM. It does not name the model or the workload.
The slides show a sample answer in which NAS 6 records seven ether2 link drops and 23 affected PPPoE sessions. They label the example illustrative. Another slide correlates interface errors, connection tracking, RADIUS sessions and PPPoE disconnects at one timestamp; it says the data are simulated and the causal explanation is a hypothesis. These examples show the answer the authors want the system to produce, not an ISP incident it has already solved.
The proposed response has two clocks. Threshold alerts should arrive before customer complaints; a dashboard and natural-language query should help staff investigate after an event. The model is an interface to joined evidence, not the evidence itself. If syslog misses the event, the polling interval skips a 14-second cut, or device clocks disagree, fluent SQL cannot recreate the missing sequence. The underlying records have to be timely, retained and joined to the right subscriber sessions before the chat window opens.
The deck calls the 90-minute baseline an estimate and the 18-minute outcome an expected impact; it supplies no ISP incident set, polling cadence, before-and-after diagnosis times, alert false-positive rate or defined test for its stated ≥95% target, and a pilot scorecard reporting those measures per incident would change the assessment.
That gap leaves a useful engineering question, not an empty story. The proposal identifies where small operators lose time: an event is fragmented across device logs, subscriber records and topology context, while human attention supplies the joins. Central collection and plain-language access could make that path shorter. But the 18-minute figure will stand or fall on a pilot that shows which event arrived, which signal caught it, what the operator saw, and when the cause was actually confirmed.
Sources: LACNIC 46 official agenda; original IMWG presentation.
Member Briefing
Deeper Profile Context
Sign in with the right membership level to unlock the full briefing and source notes.
Only for Strategic Circle
Strategic Circle
Open to all readers. Unlock profile briefings after joining and signing in.
Join Strategic CircleOnly for Leadership Alliance
Leadership Alliance
For qualified IP-asset owners and management; sign in to unlock alliance briefings.
Join Leadership Alliance