Summary
- Teraco's 2026 Sustainable Impact Report prints 399,347 MWh of energy, 388,184 tCO2e of location-based Scope 2 and 31,801 kL of water for 2025. Its Isando campus specification prints 40MVA in available IT power load against 80MVA total power, N+1 UPS and a minimum of 48 hours of backup fuel at full load design conditions.
- What never appears is megawatt-hours per facility and the IT-equipment kilowatt-hours behind the 0.03 L/kWh water ratio. Four of the five printed carbon rows re-derive from the printed energy, the printed rooftop solar and a printed grid factor to within about a tenth of a per cent. The fifth, 2023, re-derives with the later 985 g factor rather than the 949.1 g its own footnote assigns to that year. The water ratio does not divide from the printed inputs at all.
Two ledgers, one set of meters
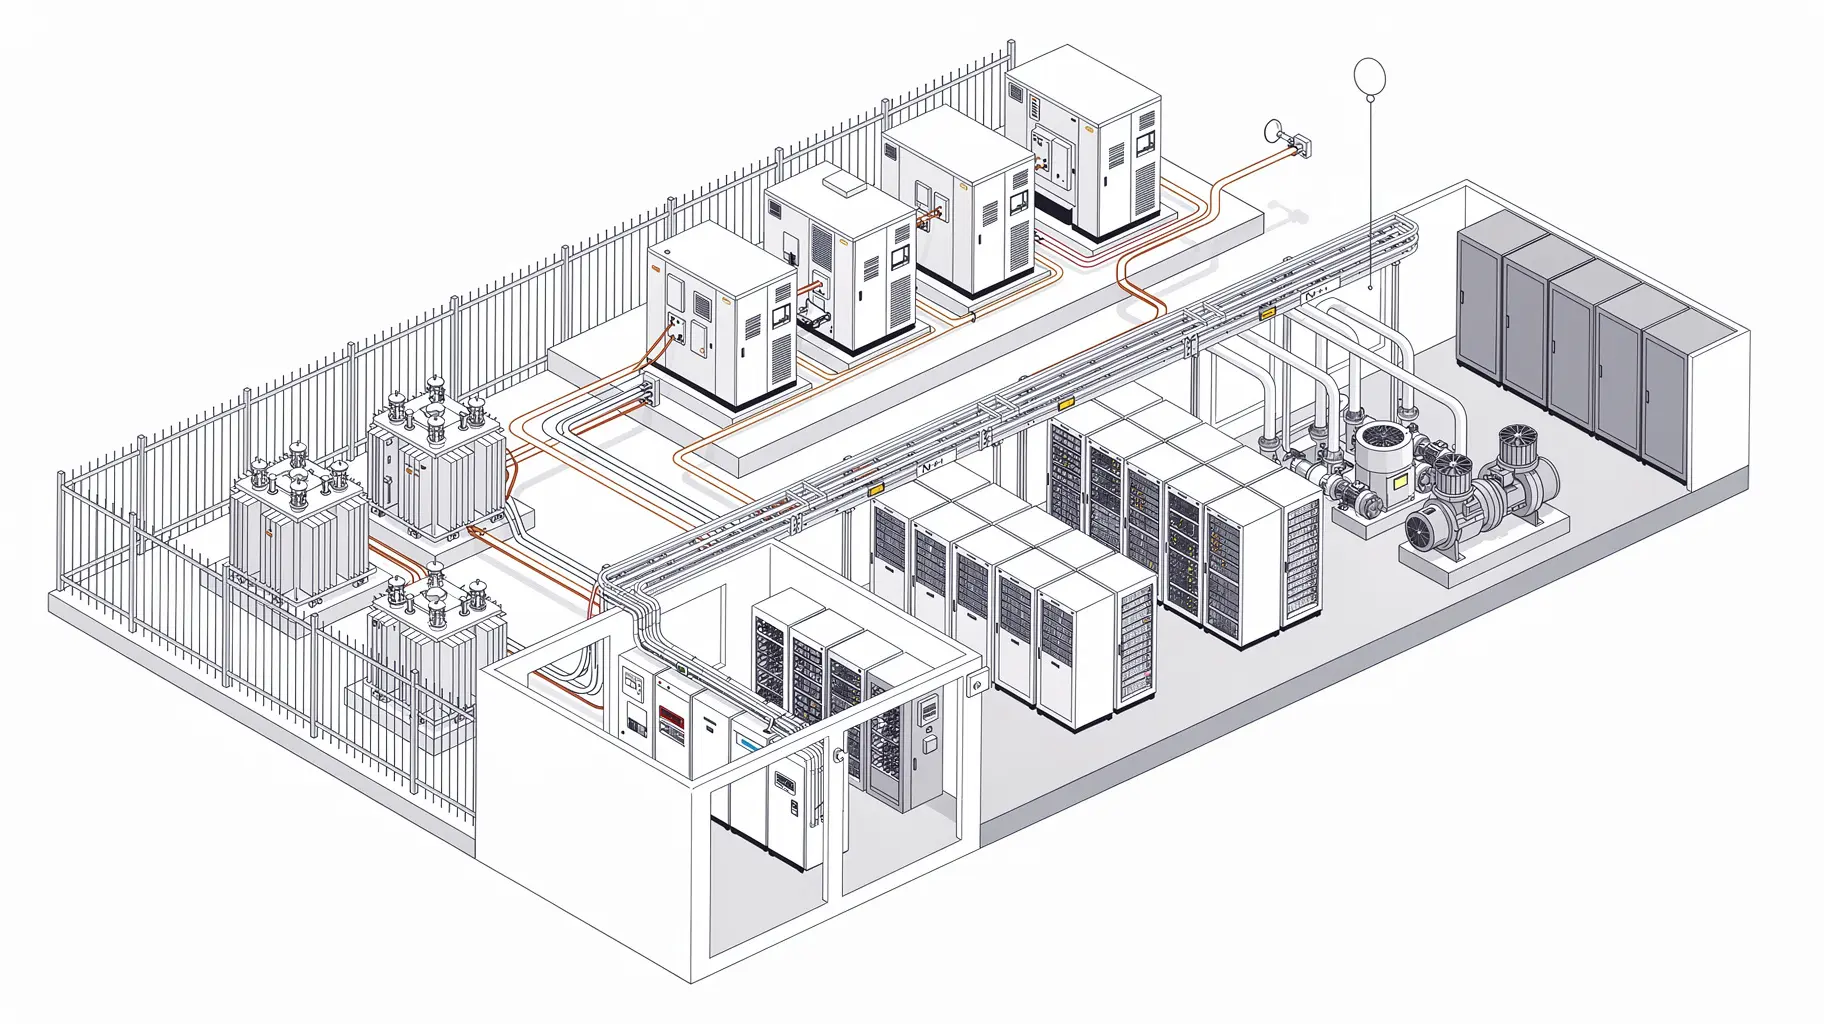
The first document is a sales sheet. The JB1 and JB3 Isando campus specification states that resilient diesel backup generators are fueled to provide a minimum of 48 hours of back up fuel under full load design conditions, and puts 40MVA in available IT power load beside 80MVA total power with N+1 UPS redundancy. That is what a tenant sizes a deployment against, and it is the number a tenant can actually verify, because the tenant knows how many racks it installed.
The second document is a stakeholder report, and it speaks a different language. Teraco's 2026 Sustainable Impact Report prints group energy consumption of 399,347 MWh for 2025, after 326,509 in 2024, 231,563 in 2023, 163,840 in 2022 and 129,999 in 2021. It prints rooftop solar production of 5,251 MWh for 2025 on the same page, against 4,769, 2,644, 2,313 and 1,825 in the years before. It prints a renewable share of 14.04 per cent for 2025 and a clean share of 18.87 per cent, alongside average annual PUE of 1.43, down from 1.55 in 2021. It prints location-based Scope 2 of 388,184 tCO2e for 2025, up from 121,640 in 2021, Scope 1 of 3,988 tCO2e, and Scope 3 of 127,422 tCO2e.
Two classes of number, one company's electricity. The sales sheet states a capability. The report states a consumption. A reader who wants to know whether the halls on that campus, which can draw 40MVA of IT load between them, are being run efficiently has to divide one by the other, and that division needs two things the operator holds and does not publish: megawatt-hours per facility, and IT-equipment kilowatt-hours.
I looked for both in every document reviewed on 21 November 2026 — the 2026 report, Teraco's own sustainability page, its report request page, the February 2025 wind power purchase announcement, the August 2024 release for the previous edition, the 2023 report as hosted by a shareholder, Digital Realty's 2024 Impact Report and the Isando campus specification. They are not there.
Where the printed arithmetic closes
The carbon row is not vague. It is a multiplication, and it reproduces.
For 2025, take the printed energy, subtract the printed rooftop solar, and apply the printed factor. 399,347 MWh minus 5,251 MWh is 394,096 MWh; times 985 g CO2/kWh gives 388,184.6 tonnes against a printed 388,184 — six-tenths of a tonne apart. For 2024 the same construction gives 316,913.9 against a printed 316,914. Both are my arithmetic, not the operator's, and both close to within a rounding step.
That single check settles a question the report never answers in words: the Scope 2 figure treats own solar generation as reducing grid draw, and applies a grid factor of 985 g CO2/kWh based on the 2021 South African Grid Emission Factor. It also tells a reader what the renewable percentage is not. Rooftop solar of 5,251 MWh is 1.31 per cent of 399,347 MWh, so the printed 14.04 per cent cannot be own generation. At that share, 56,068 MWh of the year's supply would be credited renewable, of which roughly 50,817 MWh sits outside Teraco's own panels.
The footnotes say where it comes from, and the answer is a supply mix rather than a facility: the renewable row includes Eskom supplied renewable energy and imported hydro, plus energy generated from Teraco's solar facilities, and the clean row adds nuclear to the same list. Both footnotes cite one source label, Eskom Generation Statistics 2023, for a five-year series that runs to 2025.
Where it does not close
Two printed figures resist their own inputs, and neither resistance is an accusation.
First, the 2023 carbon row. The same construction with the factor footnote 4 assigns to that year gives 217,267 tonnes against a printed 225,472 — a gap of 8,205 tonnes, or 3.6 per cent. With the later 985 g factor the row closes to within 13 tonnes. I report that as which factor the row behaves like. The 2021 and 2022 rows behave like the older factor: 121,649.9 against 121,640, and 153,305.3 against 153,151. A reader is entitled to know that one row of a five-year series sits on the other side of the factor change the report itself documents.
Second, water. The report defines water usage effectiveness as the ratio of the data centre operation's water consumption to IT equipment energy consumption and then prints a result of 0.03 L/kWh. The inputs are printed separately, and they do not divide to that. Data centre operations take 6,266 kL of the 31,801 kL total. Divide 6,266,000 litres by the IT energy implied by the printed total and the printed PUE — 399,347 MWh divided by 1.43, about 279,264 MWh — and the ratio is 0.0224 L/kWh. To reach 0.03 you need about 208,867 MWh of IT energy, or a numerator near 8,378 kL, or a PUE near 1.91. The divisor itself is simply absent, which is why I call this a gap rather than an error.
Not everything is a gap. The water table closes both ways, on supply and on use, to the same 31,801 kL, and the 17 per cent reduction from 38,330 kL in 2023 to 31,801 kL in 2025 re-derives at 17.03. The Scope 1 footnote's 54 per cent fall from 2023 to 2024 re-derives at 54.08. The report's own page repeats the same tiles without a denominator: 31,801 kL consumed, PUE 1.43, WUE 0.03 L/kWh, a 17 per cent reduction and a 10.8 per cent cut in municipal reliance.
One table convention matters here. The Scope 3 row prints no value for 2021 or 2022. That is an empty cell, not a zero, and no reviewed document converts it into one.
The instruments, sized but not delivered
The report names three renewable instruments and sizes two. Rooftop solar: a commitment above 10MW, over 14,000,000 kWh a year expected from 2027 onwards, mitigating more than 13,790 tonnes of CO2. Utility-scale: a 120MW plant with wheeling producing 354GWh a year against an estimated 348,000 tonnes. Wind: power purchase agreements with NOA, first project commercial operation expected in the third quarter of 2026.
The wind announcement of 26 February 2025 states NOA will wheel renewable energy from various wind projects to Teraco's facilities, with first power anticipated in 2026, and prints no volume, tenor or share of load. Digital Realty's June 2025 impact report puts the solar plant in context: when fully operational it will cover more than 40 per cent of Teraco's total anticipated energy requirements, and is expected to produce 354 GWh annually, with installed rooftop and carport capacity at 6.3 MW.
Those two statements sit on different denominators. 354 GWh against 2025's printed 399,347 MWh is 88.6 per cent. A share of more than 40 per cent of anticipated requirements implies anticipated requirements near 885 GWh, about 2.2 times the 2025 printed consumption. Both figures are forward-looking, and neither document reconciles them. The parent's 6.3 MW against the operator's 4,769 MWh of 2024 rooftop output gives about 757 full-output hours, 8.6 per cent of a year — and I do not read it as a capacity factor, because no reviewed document prints the commissioning date of any array.
Three dated disagreements, left standing
The August 2024 release sizes the same utility-scale plant at more than 340 million kWh of solar energy per annum when complete — a different figure, in a different unit, from a dated document. The same release sets a rooftop goal of 10MW by December 2026; the current sustainability page deploys the rooftop programme by December 2027. And the 2023 report prints 17,814 kilolitres of water consumed in 2022, three years before the 2026 report's 31,801 kL for 2025; no reviewed document reconciles the two eras, and I print them as two dates rather than one series.
Also dated, and time-bound by its own publication: the 2024 release describes the report it announced as covering seven operational facilities in South Africa. That is a statement about 2024, not about the 2025 boundary, which no reviewed document states in words.
What the reviewed set does not print
- The 2026 report was not opened at a URL Teraco owns. Its own distribution page is a request form — to receive a copy of our latest report, please complete the form below — and the direct fetch of the mirrored copy returned an access refusal, so the text used here came from extraction, without page numbers, layout, contents page or appendix.
- No reviewed document prints a per-facility energy, emissions or water figure. The report prints group aggregates, and its inventory paragraph names no facility.
- No reviewed document prints the IT-equipment kWh figure the water ratio is defined against.
- No reviewed document prints diesel litres, tank capacity, generator count or permitted running hours. The 48-hour sentence is a duration at design load on one campus; the Scope 1 footnote names diesel as a source and attaches no quantity.
- No assurance statement, provider, opinion or scope for the emissions, energy or water metrics appears in the retrieved text. The only third-party verification described covers 2021-2025 energy savings against a 2019-2020 baseline.
- No market-based Scope 2 figure is printed, although the narrative refers to market-based Scope 2 falling from 2027.
- The 2022 Scope 1 cell did not render legibly, so it is not quoted here; the four cells that did are.
- The 10.8 per cent reduction in municipal water reliance prints no baseline year on the page that carries it.
- No reviewed document reconciles the 2023 water baseline of 38,330 kL with the 17,814 kL the 2023 edition prints for 2022.
- No reviewed document states whether tenant electricity sits inside Scope 2, or which legal entity is consolidated. The inventory paragraph speaks of operations and value chain, and the company name appears in a contact block rather than a boundary statement.
- No reviewed document prints the commissioning date of any solar array.
- The campus specification is titled as a 2023 document, carries no publication date on the passages retrieved, and speaks for one campus rather than the portfolio.
What a reader is left holding
A five-year energy series that climbs from 129,999 MWh in 2021 to 399,347 MWh in 2025 — 207 per cent across the printed span, and 72.5 per cent in the last two years alone, both my arithmetic. A carbon series that reproduces from that energy and a grid factor, four years out of five. A water ratio that cannot be tested from the page that prints it. A backup-generation claim expressed only as hours at design load. A renewable programme that is sized in gigawatt-hours and dated to the first quarter of 2027.
None of that is dishonest. All of it is unverifiable at the join, and the join is where the interesting questions live: whether a hall consuming a quarter of a campus's power is run as tightly as the group average, whether water intensity really fell as fast as the headline ratio suggests, and whether the diesel that produces almost all of Scope 1 sits in tanks sized for a weekend or a fortnight. Print megawatt-hours per facility and IT kilowatt-hours, and every one of those questions becomes a division a stranger can do. Leave them out, and the reader can only read the ratios aloud.
Member Briefing
Read the full trend briefing
Members read the full briefing with the source notes behind every finding.
Strategic Circle
A daily briefing in your language, built from changes we have verified.
Join for USD 20/monthCancel anytime.
Members also get the full research library, a daily briefing on the networks they follow and the private forum.