Summary
- Total SaaS ARR was US$726.0 million; SaaS ARR excluding conversions was US$598.1 million. The US$127.9 million difference was 17.6% of total SaaS ARR by BTW calculation.
- The 52% and 25% growth rates are not rival versions of one result. The first includes migration from self-hosted contracts; the second removes that impact.
- H1 free cash flow fell from US$82.7 million to US$69.1 million even as SaaS revenue grew 62%. Migration has reached the income statement faster than it has strengthened cash generation.
Two clocks inside one subscription transition
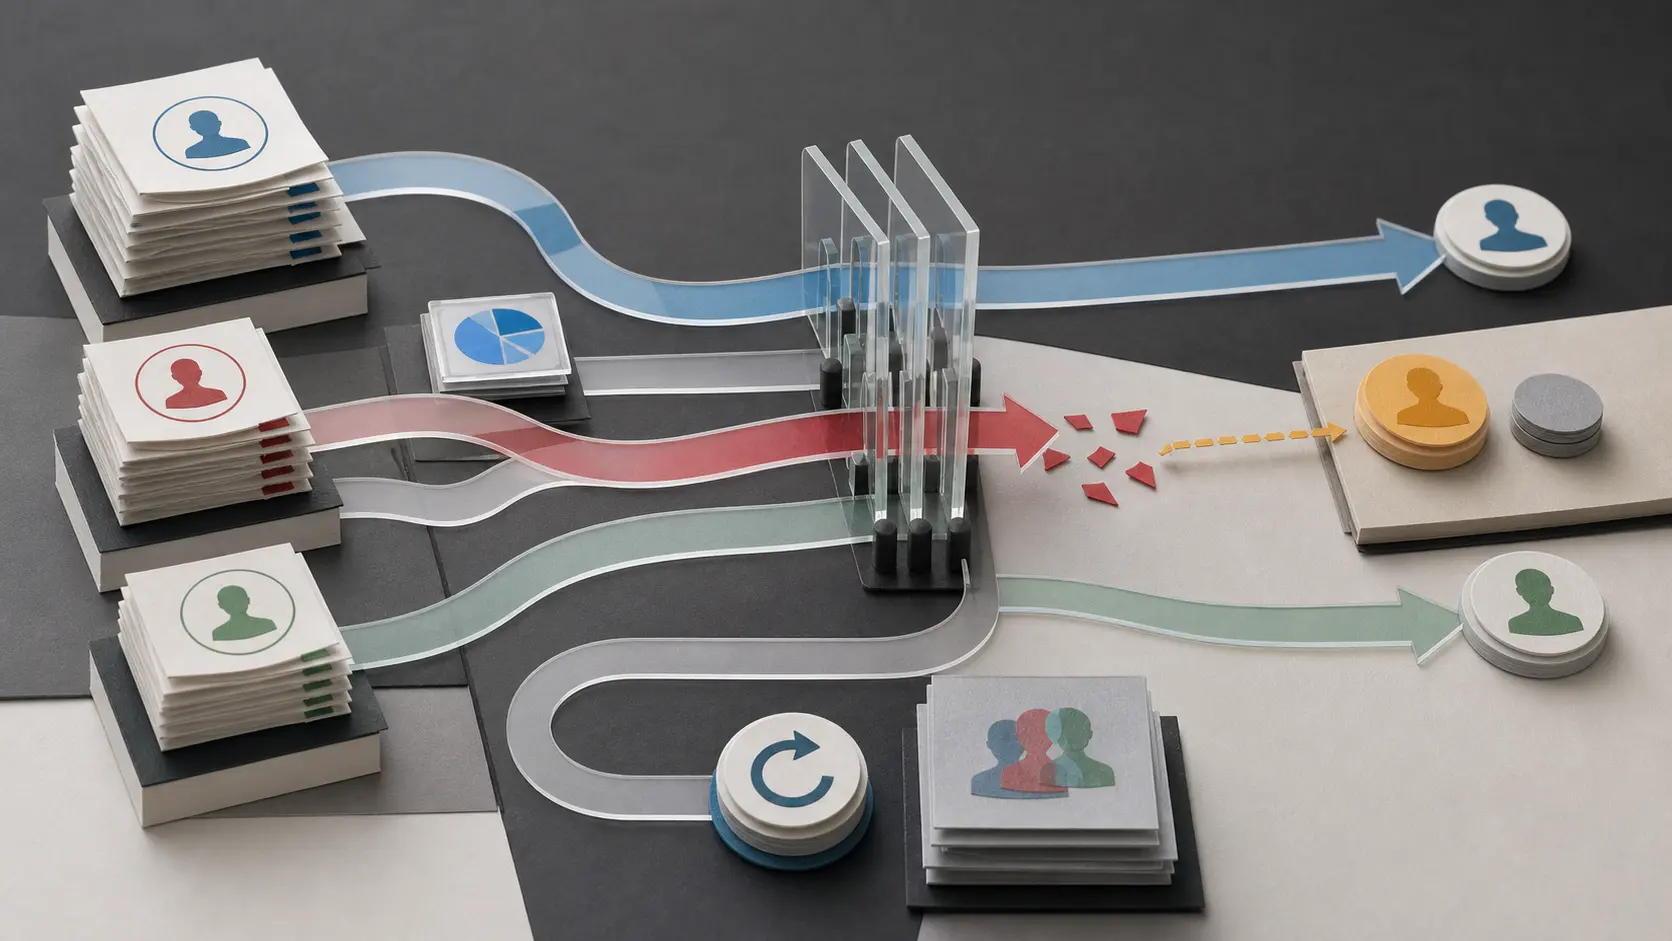
Varonis defines SaaS ARR as the annualized value of active SaaS contracts at period end. It annualizes total contract value over contract days; it does not derive the measure from historical revenue, deferred revenue or any other GAAP balance. SaaS ARR excluding conversions applies the same logic but removes the impact of customers moved from self-hosted products.
That definition makes the subtraction useful and limited. Total SaaS ARR of US$726.0 million less the disclosed US$598.1 million ex-conversion balance leaves US$127.9 million. This is a period-end layer associated with conversion impact, not US$127.9 million of quarterly revenue and not proof that migration created that much incremental customer spending. Public filings do not provide a bridge from each legacy contract through price, scope, churn and expansion.
The revenue mix shows the mechanical shift. SaaS revenue rose 62% to US$171.7 million. Term-license subscription revenue fell to US$4.2 million from US$32.4 million, while maintenance and services fell to US$4.1 million from US$13.9 million. Varonis attributes the vast majority of both declines to customers converting to SaaS. Total revenue still grew 18% to US$180.0 million: the destination grew faster than the company because value was crossing categories.
The demand test begins outside conversion
Ex-conversion SaaS ARR grew 25%. SaaS ARR from new logos grew more than 20%, although Varonis did not disclose its dollar amount or separate new customers from expansion within the US$598.1 million balance. Those are the indicators that survive after the migration pool runs down.
The company plans to end the self-hosted business on 31 December 2026 and says ARR and SaaS ARR should then become materially consistent. That creates a finite denominator event. As converted contracts become ordinary SaaS renewals, the headline growth rate loses the migration tailwind. Full-year guidance already preserves the distinction: total SaaS ARR of US$819 million to US$850 million, up 28%-33%, alongside only 20%-21% growth excluding conversions.
Contract visibility is substantial but not interchangeable with ARR. Remaining performance obligations were US$1.084 billion at June-end, with 57% expected to be recognized over the next twelve months. RPO includes deferred revenue and non-cancellable contracted amounts still to be invoiced. ARR annualizes active SaaS contracts. One is an accounting contract perimeter; the other is an operating run-rate lens.
Deferred revenue was US$435.6 million, down from US$442.2 million at year-end. The decline is not evidence that ARR failed: billing timing, recognition and contract dates differ. It does prevent the cleaner claim that every ARR gain has already become a larger collected liability.
Cash provides the final ledger. H1 operating cash flow fell to US$80.1 million from US$89.3 million; free cash flow fell to US$69.1 million from US$82.7 million. Adjusted free cash flow, which excludes acquisition-related cash costs, was US$81.0 million versus US$84.3 million. Meanwhile, Q2 showed a US$40.6 million GAAP operating loss and US$3.7 million of non-GAAP operating income. The SaaS transition is commercially visible, but durable economics still require conversion into cash without depending on the remaining legacy pool.
Sources
Member Briefing
Deeper Profile Context
Sign in with the right membership level to unlock the full briefing and source notes.
Only for Strategic Circle
Strategic Circle
Open to all readers. Unlock profile briefings after joining and signing in.
Join Strategic CircleOnly for Leadership Alliance
Leadership Alliance
For qualified IP-asset owners and management; sign in to unlock alliance briefings.
Join Leadership Alliance