
Summary
- In April 2025, Kinetic announced a US$13 million Fort Bend County fibre expansion for more than 22,000 households, estimating 2,200 households a month and more than 330 route miles by the end of that year.
- In September 2026, it reported more than 7,600 new fibre locations over the preceding year, nearly 25% network growth and more than 40,000 homes passed across the greater Sugar Land and Fort Bend area.
- The second release does not reconcile the first. Their reporting windows only partly overlap, their geographic boundaries and units may differ, and neither supplies a common opening baseline or as-built project ledger.
- A home passed is not an activated customer. Kinetic discloses roughly 29% fibre penetration across its 18-state portfolio, but no Fort Bend subscriber count, take-up rate, installation cohort, churn or local revenue.
- The next useful disclosure is a bridge from accepted construction and serviceable addresses to orders, installations, paying connections and actual capital placed in service.
Two milestones, but no common ledger
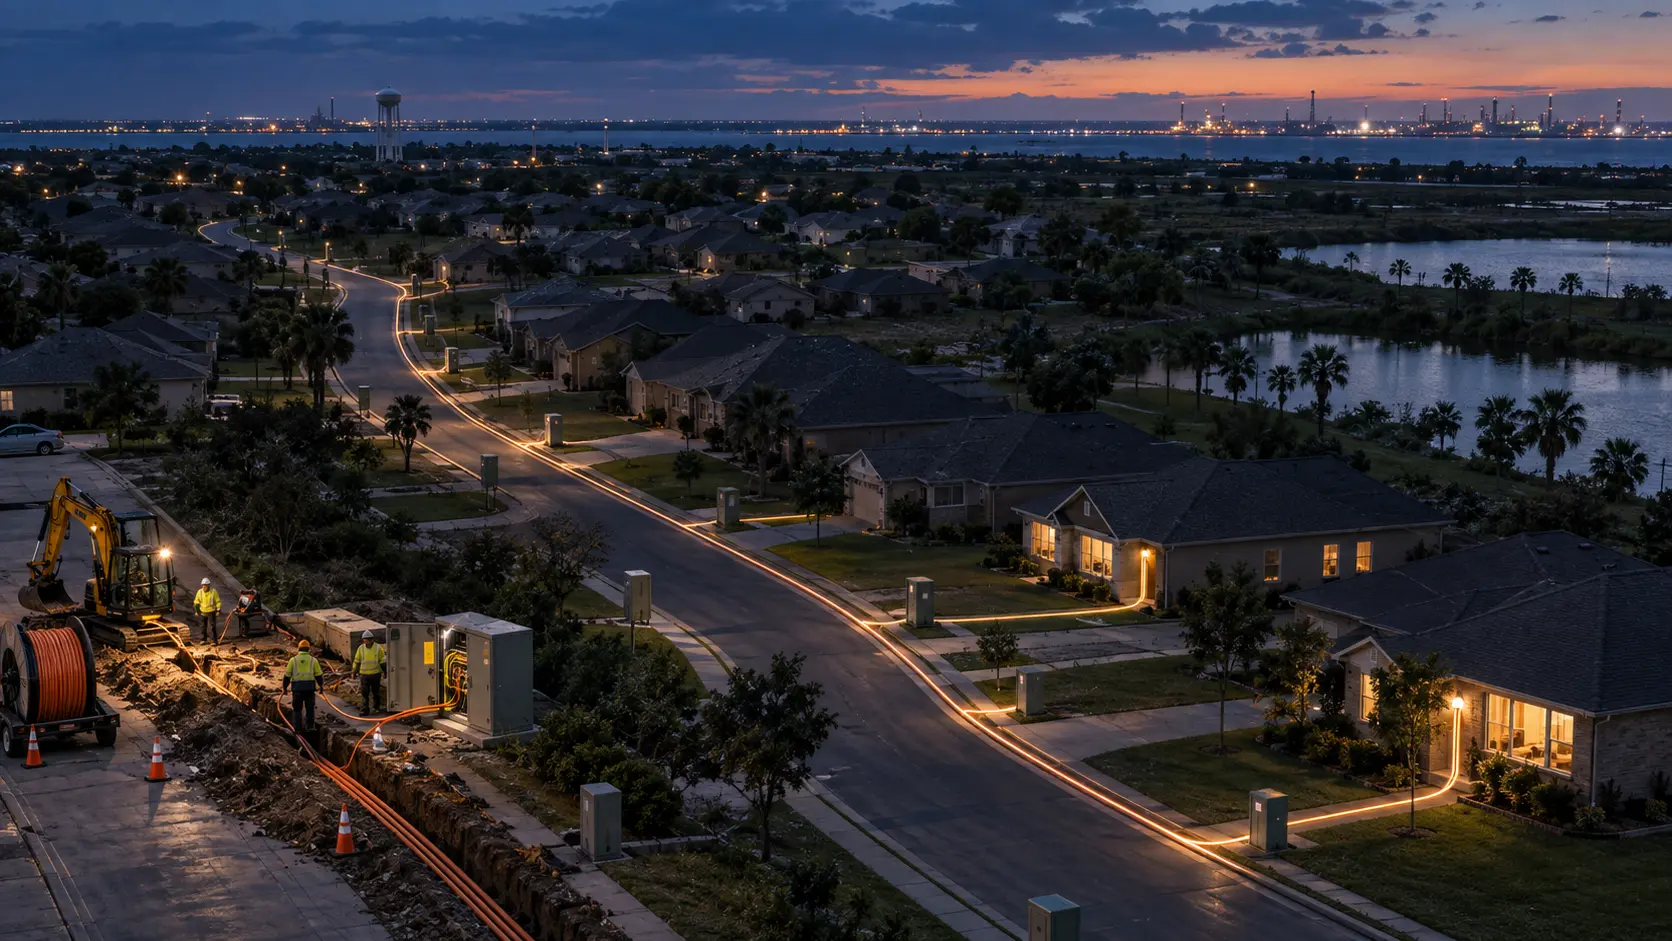
Kinetic’s April 2025 groundbreaking announcement was unusually specific for a local broadband build. The company described a US$13 million expansion in Fort Bend County that would connect more than 22,000 households. It expected to reach about 2,200 households a month and planned more than 330 miles of fibre by the end of 2025. It even named neighbourhoods, including Sugar Creek, Colony Meadows and Lexington Meadows.
Seventeen months later, Kinetic announced a different sort of number. Its September 2026 milestone said the network in the greater Sugar Land and Fort Bend County area had grown by nearly 25% in the previous year. More than 7,600 new fibre locations had taken the total past 40,000 homes passed. The recent expansion, it added, was fully funded by Kinetic.
Both statements can be true. Together, however, they do not produce a project account. The 2025 release describes a programme target. The 2026 release describes a regional stock and a one-year increment. It does not say how many of the 7,600 locations belonged to the US$13 million programme, how many of the planned 22,000 had been accepted into service, or whether the greater Sugar Land boundary is identical to the earlier Fort Bend project area.
That distinction matters because public infrastructure numbers are often read as a sequence even when they are not built on the same denominator. A target, an annual construction increment and a cumulative footprint answer three different questions. Without a common baseline, stacking them creates a story that the disclosures themselves do not support.
The arithmetic works—and exposes the missing bridge
The September figures contain one useful consistency check. A network above 40,000 homes after adding more than 7,600 locations implies an earlier base above roughly 32,400. Dividing 7,600 by 32,400 gives about 23.5%, which fits the company’s description of growth as “nearly 25%”. Because both numbers are lower bounds, the calculation cannot recover an exact opening or closing count.
The 2025 plan has its own simple arithmetic. More than 22,000 households at about 2,200 a month represents roughly ten monthly production equivalents. US$13 million divided by 22,000 planned households is about US$591 per planned household. Divided by 330 planned miles, it is about US$39,400 per mile.
Those ratios are not unit economics. The budget may cover feeder and distribution fibre, electronics, make-ready work, drops, labour or other items in combinations the release does not specify. A planned household is not necessarily an accepted serviceable address, and a planned mile is not an as-built mile. The ratios are merely reference points for the eventual receipt.
There is also a visible tension. If the entire 22,000-household plan were incremental to the implied pre-September-2025 base above 32,400, used precisely the same geography and unit, and had been completed, the combined total would exceed 54,400. The reported endpoint is only described as more than 40,000. This is not evidence that Kinetic missed the plan. It is evidence that the assumptions required to compare the figures—boundary, baseline, timing, overlap and unit—have not been disclosed.
The calendar windows only partly meet
The first announcement arrived in April 2025 and set an end-2025 construction horizon. The second counts the year preceding September 2026. Those windows overlap mainly in the last months of 2025. Work completed between April and August 2025 could sit inside the 22,000 plan while being outside the later one-year increment. Work after January 2026 could sit inside the 7,600 increment while being outside the original end-2025 timetable.
A separate Texas update published in April 2026 adds context but does not close the gap. Kinetic said it delivered fibre to another 7,900 homes across 100 Texas communities in the fourth quarter of 2025 and listed Sugar Land among the places where it continued building. It also reported more than 216,000 homes and businesses with access statewide. None of those statewide totals identifies the Fort Bend portion.
The nouns shift too. The releases use “households”, “fibre locations”, “homes passed”, and, at state level, “homes and businesses”. They may refer to closely related operating measures, but investors and county partners should not treat them as interchangeable without a definition. The project may also upgrade addresses already served over copper, which creates value but complicates any assumption that each planned household adds one entirely new passing.
Passing a home creates an option, not a customer
Kinetic’s language makes the commercial boundary visible. Its two-million-premises announcement says each new premise passed puts more homes and businesses within access of fibre. Access is the beginning of a sales process. It does not show that an address is orderable on a given day, that a drop has been installed, or that the resident pays for service.
Uniti defines fibre penetration at Kinetic as consumer fibre subscribers divided by consumer premises passed. At the end of 2025, the company reported about 535,000 subscribers across roughly 1.9 million premises, or 29%. Its second-quarter 2026 materials showed roughly 603,000 consumer fibre subscribers and 2.1 million homes passed, again around 29%.
That portfolio figure is useful because it demonstrates why passings and customers must be separated. It is not a proxy for Fort Bend. Newer cohorts usually have had less time to sell; neighbourhood income, housing density, incumbent competition, pricing and installation capacity can create wide local differences. Applying a 29% company average to the 40,000 local footprint would manufacture a subscriber estimate the company did not disclose.
The operating ladder should instead remain explicit: construction designed; construction completed and accepted; addresses serviceable; orders placed; installations completed; paying subscribers retained. A bottleneck at any step changes the economics. Civil work can be finished while address data remains unavailable. Orders can arrive faster than technicians complete drops. Connections can rise while promotional prices or churn weaken contribution.
“Fully funded” is not the capital receipt
The September release says the expansion was fully funded by Kinetic. That identifies who supplied the money, not how much was spent or what was delivered for it. It does not say whether the recent expansion exhausted, supplemented or sat outside the earlier US$13 million budget.
At group level, capital is abundant but pooled. In June 2026, a Kinetic subsidiary priced US$1.14071 billion of secured fibre-network revenue notes, backed by certain fibre assets and customer agreements across ten states including Texas. The financing can support a broad construction strategy. It cannot be allocated to Fort Bend from the public disclosure, and securitised collateral is not the same thing as a local project-cost statement.
For the county and for investors, the useful capital bridge would be modest: original budget, approved changes, capital placed in service, as-built route miles, serviceable premises and completed installations. From those values, users could distinguish cost per passing from cost per connected customer, and could see whether reuse of existing ducts or copper-service corridors improved the build.
Sources
- Kinetic’s April 2025 Fort Bend groundbreaking announcement
- Kinetic’s September 2026 Sugar Land and Fort Bend milestone
- Kinetic’s fourth-quarter 2025 Texas build update
- Uniti’s 2025 Form 10-K
- Uniti’s second-quarter 2026 results
- Kinetic’s two-million-premises announcement
- Uniti’s June 2026 Kinetic securitisation disclosure
Member Briefing
Deeper Profile Context
Sign in with the right membership level to unlock the full briefing and source notes.
Only for Strategic Circle
Strategic Circle
Open to all readers. Unlock profile briefings after joining and signing in.
Join Strategic CircleOnly for Leadership Alliance
Leadership Alliance
For qualified IP-asset owners and management; sign in to unlock alliance briefings.
Join Leadership Alliance