- Bitcoin halving events occur every four years, reducing the issuance of new bitcoins by half, impacting miners’ rewards and the rate of new coins entering circulation.
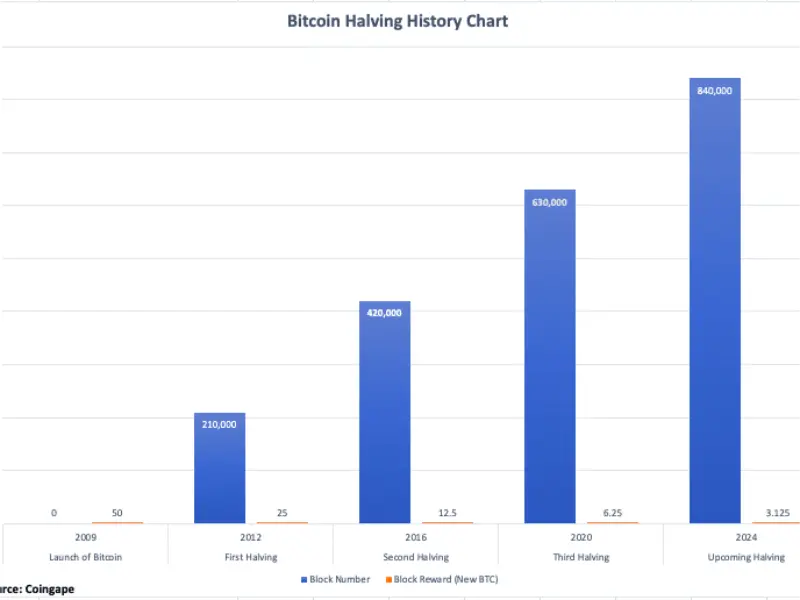
- The Bitcoin Halving History Chart visually illustrates the chronological sequence of halving events, changes in mining rewards, and bitcoin price fluctuations, aiding in understanding supply patterns and market impacts.
- Each halving event, including the upcoming fourth halving in 2024, has historically led to an increase in bitcoin’s value, though the magnitude and timing of these increases may vary due to factors such as market sentiment and global economic conditions.
Every four years, the issuance of new bitcoins undergoes a halving, reducing by half on the designated day. This means that during a bitcoin halving event, the reward given to miners is decreased by 50%, directly affecting the rate at which new bitcoins enter circulation. The day on which the reward halves is known as the halving day, a significant event in the cryptocurrency world, having occurred three times since bitcoin’s inception. Let’s delve into the historical chart of bitcoin halving for deeper understanding.
What is the bitcoin halving history chart?
The Bitcoin Halving History Chart visually represents the chronological sequence and impact of halving events. Typically, it displays the dates of halving events, changes in mining rewards, and often includes the fluctuations in bitcoin price throughout its history. These charts aid in understanding the cyclical patterns of bitcoin’s supply and their potential impact on the market. Now, let’s explore how these halving dates have evolved over time.
Also read: Who is Satoshi Nakamoto? The hunt for bitcoin’s elusive founder
1. First halving – November 28, 2012
The inaugural bitcoin halving occurred after the verification of 210,000 blocks, reducing miners’ rewards from 50 to 25 bitcoins per block. At the time, the price of bitcoin stood at $12.20 in the market. Following the halving, a bull run ensued, propelling bitcoin prices to $1,000 by the end of 2013.
2. Second halving – July 9, 2016
Four years later, the second halving took place in 2016 after 420,000 blocks were processed, resulting in a reduction of mining rewards from 25 to 12.5 bitcoins per block. There were uncertainties regarding bitcoin prices leading up to the halving, yet bitcoin was trading at $650.3 during the event. Subsequently, in May 2017, bitcoin gained momentum, reaching a peak of around $19,188 by December of the same year.
3. Third halving – May 11, 2020
The third halving event occurred after the processing of 630,000 blocks, halving miners’ rewards from 12.5 to 6.25 bitcoins per block. This event underscored bitcoin’s growing prominence in the financial sector. Bitcoin began at $8,821.42 before swiftly climbing to $10,943 150 days later. It reached its peak value of $69,000 in November 2021.
Also read: 7 things you need to know about the bitcoin halving
4. Upcoming fourth halving – 2024
The forthcoming halving, as per CoinMarketCap, is anticipated to occur after 840,000 blocks have been processed, on April 19, 2024. Miners anticipate further reduction in rewards from 6.25 to 3.125 bitcoins per block. Enthusiasts and investors speculate on how this halving will impact the market, generating anticipation.
Experts suggest that this upcoming halving may differ from previous ones due to the introduction of spot bitcoin ETFs. These ETFs enable broader access to bitcoin among investors, financial advisors, and capital allocators, potentially fostering increased mainstream adoption.
The approval of US spot bitcoin ETFs resulted in $1.5 billion in net inflows within the initial 15 trading days, equivalent to three months of selling pressure post-halving. Continued net inflows could offset mining issuance selling pressure, potentially positively transforming bitcoin’s market structure.
Nevertheless, only a few days remain until the next bitcoin halving event, and its eventual impact on bitcoin price and the entire crypto market awaits observation. Whether speculations and predictions regarding the post-halving crypto market will materialise remains to be seen.
Throughout history, each bitcoin halving has coincided with an increase in BTC’s value, albeit with variations in magnitude and timing. Halving reduces the rate of new bitcoin creation, resulting in a decrease in supply, which may trigger a bullish market response. However, various factors such as market sentiment, investor behavior, and global financial conditions can influence the exact outcome.

